A preliminary analysis of air pollution data collected by IIITH in collaboration with Ashoka University and OP Jindal University highlights the need for continuous monitoring of air quality across various parts of cities.
Air pollution is rampant everywhere and deadlier than we think. According to experts, the most lethal type of air pollutant is particulate matter – microscopic solid particles – due to its ability to penetrate into the lungs and the blood stream. Prolonged exposure to particulate matter (PM) in air can cause respiratory diseases, DNA mutations, heart attacks and premature death. As per the WHO, up to 80% of deaths related to PM could be avoided in the world if the current air pollution levels were reduced to its new recommended air quality level guidelines. Low and middle-income countries are currently the most affected thanks to large-scale urbanisation and economic development contributing to growing levels of air pollution.
Current Status Of Air Quality Monitoring
Determining safe limits of air quality for human beings and curbing the pollutants however requires air pollution data. In India, air quality data is publicly available with the Central Pollution Control Board. But this is not exhaustive since official air quality monitoring stations are sparsely located across Indian cities. The equipment deployed by government pollution control boards, private industries, and big research organisations is expensive and not scalable. With these monitors currently present at a few restricted locations, there is an urgent need to not only increase the coverage to improve the spatial resolution of PM data but also to record data on a continuous basis. Besides this, real time air quality data at desired locations is also currently not feasible.
What IIITH Team Did
In order to address these issues, a research team from the Data Sciences and Analytics Centre, IIITH, comprising of Prof. P. Krishna Reddy with PhD scholars Chandra Shekhar N and A Srinivas Reddy conducted an exercise in air quality data collection with low-cost sensors. The preliminary study was spread over a period of 4 months from October 2021 to February 2022 in Hyderabad. The observations have been published in a research paper titled: “Air Quality Data Collection In Hyderabad Using Low-Cost Sensors: Initial Experiences”. Chandra Shekar remarks that despite some limitations reported in their accuracy, low-cost sensors were used for the study because they provide an opportunity to improve spatial and temporal resolution of air quality data. Static monitors were fixed at 4 locations which possessed uninterrupted power supply and internet connectivity while portable monitors were carried along on a bike on selected routes twice a week. PM2.5 and PM10 values were recorded from the monitors respectively.
PM2.5 and PM10 Values
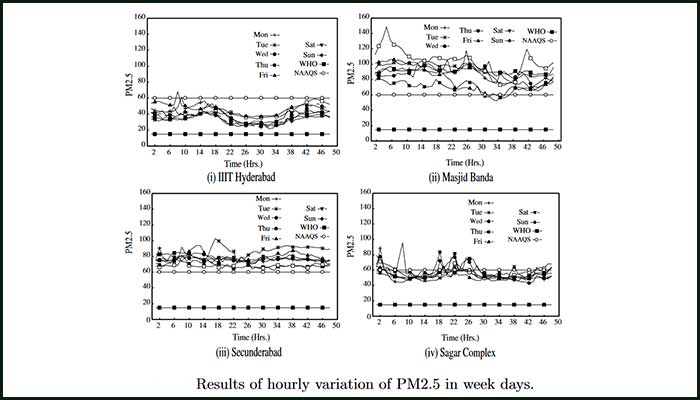
The collected data from areas such as Masjid Banda, Secunderabad, Sagar Complex and IIIT Hyderabad was compared with WHO’s new guidelines as well as the National Ambient Air Quality Standards (NAAQS). “We calculated the hourly variation of air quality per day, the hourly variation in the weekdays, monthly variation in the weekdays and variations across weekdays,” remarks Srinivas. The team found that the PM2.5 values exceeded WHO safety guidelines at all the 4 locations with Masjid Banda reporting the highest PM2.5 values. Similarly none of the locations recorded PM10 values that met WHO criteria. Except for IIITH, PM10 values at the other 3 locations did not meet NAAQS guidelines either. “Our analysis shows that the values of PM2.5 and PM10 are generally high in neighbourhoods where there is a lot of construction activity and heavy movement of vehicles,” states Chandra Shekar.
Data Need Of The Hour
According to Prof. P.K Reddy, the implications of the study are many. For one, it will provide the necessary impetus to develop a cost-effective and robust air quality data collection network. And more importantly, it could contribute to changes in policy decisions towards revising national standards. For individual stakeholders, localised air quality information could help optimise and schedule their daily outdoor activities. For instance, one can step out for a walk when the air quality is cleaner, or school timings can be changed to facilitate movement of children when the pollution levels are lower.

Sarita Chebbi is a compulsive early riser. Devourer of all news. Kettlebell enthusiast. Nit-picker of the written word especially when it’s not her own.


Next post