
Knowledge is everything. IIITH researchers show how actionable insights on all facets of air pollution can help – from empowering citizens to make informed choices on where to reside to assisting the government in mitigating its health risks.
A contractor of a road-widening project that was recently underway near a government school in Gopanpally, Hyderabad, was taken aback when confronted with irate residents. They showed him poor AQI (air quality index) levels responsible for their dust-laden discomfort, compelling him to sprinkle water on the roads in order to lessen the clouds of fine dust. Such impact has been possible due to the installation of an air pollution monitoring device at the government school by IIITH. It is part of a multi-disciplinary project on “IoT enabled Smart Cities: Pollution, Health and Governance”. The research is funded by the National Geospatial Programme (NGP), DST, India and the PRIF Social Incubator Program (2019). It is a collaborative effort with the Smart City Living Lab at IIITH, the Society for Cyberabad Security Council (SCSC), and the state Government of Telangana. “We’re trying to monitor the levels of air pollution in the city of Hyderabad, to study its effects on health and then we will present our findings to the government to take the necessary steps to deal with it,” says Prof. Sachin Chaudhari, who is leading the IoT-based air pollution monitoring efforts.
Air Quality and Mortality
Breathing in bad air, frequently considered an irritant at best, is actually fatal in the long run. In 2019, inferior air quality ranked fourth among high-risk factors leading to early deaths worldwide. It trailed behind other causes such as high blood pressure, tobacco use and a poor diet. In India, toxic air quality hits headlines typically with the onset of Winter. With biomass burning in the Northern parts and the festival of Diwali exacerbating the toxicity levels, air pollution however is not only making news but also increasingly being analysed. The recent report by the Centre for Science and Environment showed that deaths due to PM2.5 (particulate matter that are 2.5 micrometers in diameter and inhalable) pollution in India have increased by 2.5 times over the last two decades.
While particulate matter in the air has been monitored for some years now, the systems used by the Central Pollution Control Board (CPCB) are expensive, and unwieldy leading to its sparse deployment. Prof. Chaudhari, cites the instance of a mere six monitoring stations covering the entire city of Hyderabad by the CPCB. The professor who is also part of the team behind the Smart City Research Centre at IIITH has been researching on improving the quality of life in the urban context, with air quality being a focus area.
What They Have Done
A large research team with students from both the Computer Science and the Electronics and Communication streams initially began the AirIoT project by monitoring PM2.5 and PM10 (particulate matter 10 micrometers in diameter) in the IIITH campus. In the first phase, the group installed 10 monitoring devices inside the campus just before Diwali 2019. In the second phase of the project during 2020 and 2021, they ventured outside the campus and deployed around 40 devices in the Gachibowli area – at traffic signals, in public gardens and even in some residential gated communities. In addition to research students, Vivek Gupta from the Electronics lab also actively participated in this activity.
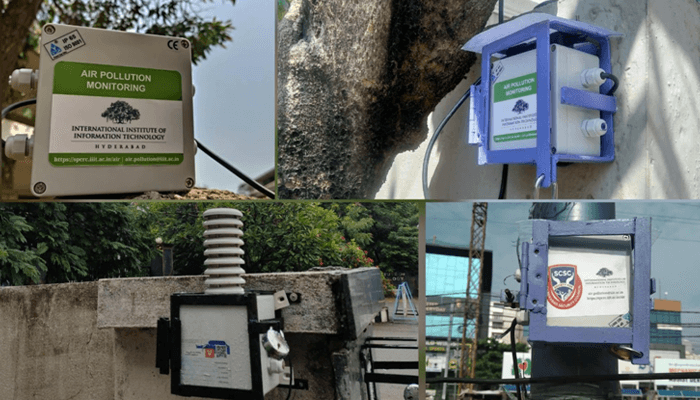
Realising soon enough that in order to cover the entire city, a mobile solution would be more appropriate, the team has now collaborated with a local college. With its buses crisscrossing the entire length and breadth of the city, a few sensor nodes have been deployed atop them. What makes the air pollution monitoring project even more unique is that the sensor devicess have been designed in-house by the IIITH team. “The off-the-shelf devices were bulky, impractical and expensive. We designed IoT-enabled ones that are not only compact in size but low-cost too,” says Prof. Chaudhari, explaining that buying monitoring devices also entailed grappling with the bugs inherent in them. “Shipping them out to their manufacturer to fix the issues involved a long turn-around time which was not feasible for us.” In addition to designing the sensing devices, the researchers developed an algorithm that changes the frequency at which the sensors sense PM. “A change in seasons affects the patterns of particulate matter. Having a fixed and pre-defined sensing rate for the nodes was energy inefficient,” says researcher Rajashekar Reddy.
When the Covid-19 pandemic struck and improvements in air quality were reported globally due to the lockdown(s), the researchers set out to quantify the change in Hyderabad city’s air quality. They found that while the PM values dropped significantly during that period, not all of the decline could be attributed to the lockdown. “In Winter, air quality declines in general. On the other hand, when Summer kicks in, we typically find PM values decreasing with a corresponding increase in temperature. Since the lockdown took place in April, this explains the ‘improvement’ in Hyderabad’s AQI,” says Prof. Chaudhari.
AirIoT – How It Works
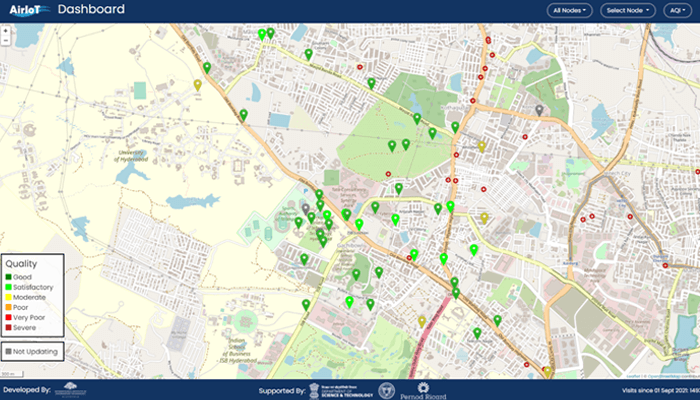
Real time air quality data from all these outdoor devices gets transmitted to a cloud computing-based web server via an IoT sensor network. The raw data is automatically calibrated at this end before getting displayed on a dashboard. The web-based dashboard shows at-a-glance pollution levels in real-time in the areas under surveillance. Ayush Dwivedi, who has been helping in operationalising the project along with other scholars, calls it an important contribution and says, “An essential aspect of dashboard development is creating a backend-framework that can now easily be re-used for developing dashboards for other IoT applications”.
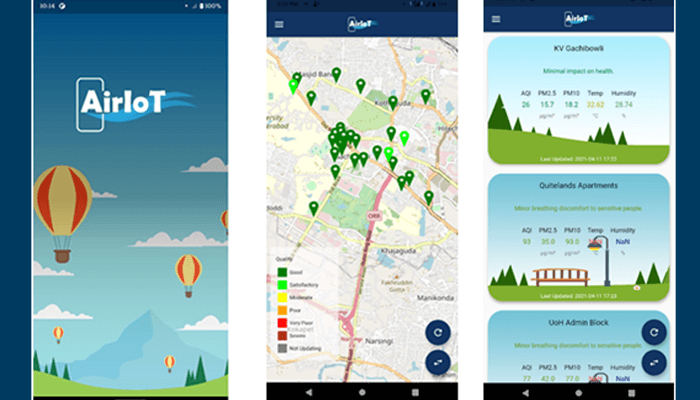
The same information from the dashboard is also available via a sleek app (available for download on Google Play Store) that has again been built by students. It displays a map of all the locations where the sensor nodes have been deployed. Each location is represented by a card that changes colour based on the change in AQI values. For instance, if the value is greater than 200, the background is displayed in red.
Securing The Devices
The scale at which air pollution is currently being monitored by the team is significantly large especially for the area under coverage. “For an area of hardly 4 sq km, we have 50 sensor nodes deployed,” says Prof. Chaudhari, adding that the microcontrollers used in the nodes are cheap and hence don’t possess a high computing power. It means that the devices don’t have the kind of sophisticated security systems in place, the kind one sees in mobile phones and computers. To understand the vulnerabilities that exist in the IoT network, GV Ihita, Siddharth De, and Aman Singh performed a security audit on 13 sensor nodes. “Before scaling up the project and deploying nodes in far-flung locations, we wanted to categorise all the sorts of threats the systems might have. We analysed the vulnerabilities from the hardware and the network perspective, as well as that of the dashboard. We found a considerable number of issues and looked for ways to patch them. Based on this analysis, our group has now come out with recommendations on securing the systems,” says Ihita.
Beyond Particulate Matter
While particulate matter is the most dominant of air pollutants, there are others too like gas emissions in the deadly mix. According to Prof. Chaudhari, monitoring of gases such as sulphur dioxide (SO2) and nitrogen oxide in the air is particularly challenging because the sensors currently used are not reliable. In a research project that is currently underway in collaboration with the University of Helsinki, researcher Sara Spanddhana is working on calibrating low-cost gas sensors. “Accuracy of gas sensors is always highly suspect. I’m trying to run different machine learning algorithms to increase the accuracy of these sensors,” she says.
Monitoring Indoor Air
Much like how outdoor air quality affects our health, there are indoor air pollutants too that compromise our well-being. Sources of indoor PM include those generated through cooking, burning of candles, cigarette smoking and so on. “We experimented in our faculty quarters and found that the values in the kitchen are different from those found in the living room. But if there is proper ventilation, and if a door or a window is opened, the values change drastically,” says Prof. Chaudhari.
With declining Covid-19 cases in the country, when students started returning to the campus, a need to assess adequate ventilation in indoor spaces arose. In general, a high CO2 concentration indoors indicates a lack of acceptable ventilation and an increase in Covid-19 risk if an infected person is nearby. “According to EU, if the CO2 values are above 800 ppm, then either occupancy of the space needs to be reduced or ventilation to be increased,” says Ayu Parmar who has been working on a highly compact plug-and-play devicer along with Rishikesh Bose and Harsha Narla. The device has been deployed in the labs and the library. It monitors the indoor CO2 levels and immediately alerts authorities whenever the values are high, prompting them to open up windows to let in fresh air.
Privacy
The downside to having an indoor PM sensor is that since it records all indoor activities that lead to an increase or decrease in PM, anyone with access to the data can do a pattern analysis of the same. “For instance, whenever rotis are being cooked at home, the PM values increase. So it can tell when you are cooking, what you are cooking, if you are cooking at all or ordering in food that day, and so on. We are therefore working on the privacy aspects of this too to make it more secure,” says Prof. Chaudhari.
New-Age AQI Monitor
Unless you live in an area that has a dense deployment of air pollution sensors and have regular access to the AQI data, most of us are in the dark about the surroundings we live in. In a bid to democratise the availability of such data, the team has embarked upon a very novel experiment. Very soon, thanks to the efforts of Ishan Patwardhan, Jayati Narang and Nitin Nilesh, you will be able to obtain precise AQI levels at any given spot with just a smartphone. Explaining his work on creating a new mobile edge computing device that is currently underway, Ishan says, “With this device, we are trying to eliminate sensors completely. All one has to do is take a picture from a smartphone and it will reveal the AQI.” For training the model, data consisting of traffic imagery has been collated from camera footage obtained while driving through Hyderabad city roads. The machine learning model analyses AQI based on traffic density, visibility, temperature, and humidity.
Impact
Collection and analysis of air pollution data from urban areas is just one part of the mega project. Prof. Kavita Vemuri is spearheading the correlation of this data with the quality of health as revealed through respiratory, cardiovascular and psycho-physiological parameters in people. Additionally, efforts by Prof. Rajan in the dynamic geo-visualisation of the air pollution data via a web-based spatial data platform will provide citizen advisory and help in governance. “Right now, there is no air pollution data at the street or area level. We only see it at the city level, if at all. With this comprehensive project, our aim is to look at the concern of air pollution from all possible angles. We hope that the insights we get can help the government in taking appropriate action as well as enlighten citizens about the perils of poor air quality,” signs off Prof. Chaudhari.

Sarita Chebbi is a compulsive early riser. Devourer of all news. Kettlebell enthusiast. Nit-picker of the written word especially when it’s not her own.
Next post