While the Mood of the Nation surveys typically undertaken at regular intervals by the Centre for the Study of Developing Economies (CSDS) through its research programme, Lokniti, collect data through traditional means to gauge public opinion on contemporary politics, social life or economic issues, in the run-up to the general elections this year, IIIT-H is trying to attempt the same via sophisticated machine learning tools. Let’s find out how.
During the 2014 Indian General Assembly elections, there were estimated to be more than 800 million first time voters below the age of 25. To woo such youngsters whose presence can be found more online than off it, the election campaign platform shifted its focus to social media activities. In fact, as an initiative to encourage more people to vote, Facebook rolled out a new feature enabling Indian citizens to add a new life event where they could show that they are Registered to Vote (alongwith a Date, Photo, Place and an optional story about who they’re voting for). Google introduced the Google Election hub to empower voters and by giving more information about the elections and the candidates. Borrowing from the US Presidential elections where Barack Obama’s winning strategy was the heavy usage of online social media, Indian politicians too began using tools such as Twitter, Facebook, YouTube, Google Hangouts to influence the digital community. While the BJP was miles ahead in the last elections in tech-savvy terms, the opposition Congress seems to be catching up in the 2019 battle.
Digital India
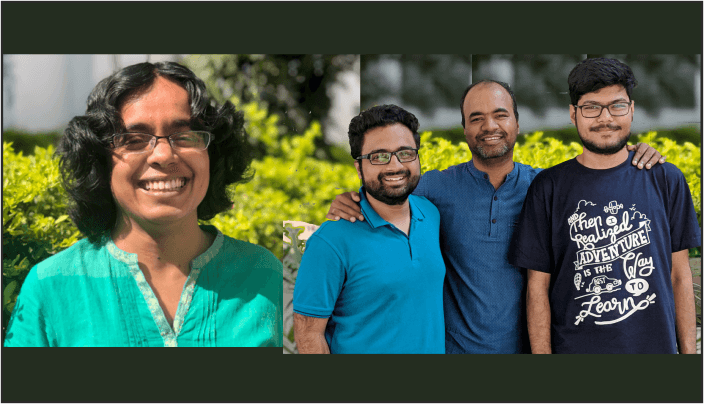
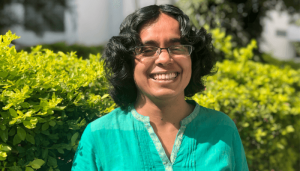
Corroborating the pervasiveness of technology across India is the latest information released by the Telecom Regulatory Authority of India (TRAI). As of September 2018, there were 56 crore narrowband and broadband connections in India. And out of the 56 crore total internet connections, 54 crore are via mobile phones (i.e, 96%). Of these 56 crore connections, 64% or 36 crore are in the urban areas and 36% or 19.4 crore in the rural areas. “We have an unprecedented number of smartphone users, prevalence of free Wi-fi, and consequently people connected to the internet. “It is probably high time we rethink our use of the word “digital divide”. As far as access is concerned, the concept of a digital divide between rural and urban India is overrated,” claims Prof. Radhika Krishnan, self-confessed ‘lapsed engineer’, keen follower of Politics and Environmental Studies at the Centre for Exact Humanities at IIIT-H.Prof. Krishnan reminds us that political scientists trained as psephologists have for long been trying to understand voter behavior:“They are trained to pick up the churning that is happening in society – one that is easily visible as well as that which is not”. There are issues which play a huge role in Indian politics such as caste, economic schemes, and the debate over the construction of a Ram Mandir in Ayodhya, among others. For Prof Krishnan, the challenge lies in mapping out these trends on digital media.
Online Electoral Battle
Even though it has been argued and some previous studies (Mislove et al.) have demonstrated that social media provides a biased, non-representative sample of the population, the importance of online communications can hardly be ignored. Referring to the Hindu-Muslim unrest that took place in UP in 2013 (fuelled by fake videos uploaded on social media) and the subsequent electoral windfall for the BJP in UP in the 2014 elections, Prof. Krishnan says, “If Muzaffarnagar 2013 had one lesson for us, it is this: there is a huge capability for social media to influence elections, especially through WhatsApp. If we have access to what’s happening on WhatsApp, we can do an excellent electoral prediction. However, tomorrow even hypothetically if there is access to WhatsApp data, I don’t want to go there for simple privacy reasons. Twitter by definition, is a public platform.” That said, she acknowledges Twitter’s limitations and agrees that Twitter can bedominated by those who can give the impression of “representing” the entire nation even if that’s not the case.
Pilot Study
Prof. Krishnan’s first pilot project was on the Gujarat 2017 elections. She and her students picked up few hashtags related to the Gujarat polls and crawled all the tweets. They looked at newspaper articles and tweets before the elections and before the results while aiming to answer the question: Are newspapers analyzing elections highlighting something which Twitter is not interested in? “I wanted to know if the Editorial offices were over-reading or hyping up something which actually does not have any impact on the ground,” she says. For Prof. Radhika personally, demonetisation was the trigger. When demonetisation was announced, newspapers across the nation highlighted reports of common people suffering, long queues for cash in banks, black money not entirely traced, and so on. The assumption was that the anger against demonetisation would translate into a vote against the BJP in the 2017 UP elections. It didn’t happen that way. What the research team found was some elements of a disjunct between tweets and newspaper reports.
2019 Elections Study
Learning from the pilot study, Prof. Krishnan found that an old-style statistical analysis will not do. “Just the frequency of the appearance of a particular word or hashtag will not tell us anything about the associated sentiment. For a social scientist, context is everything,” she says. Sophisticated tools that are often used in the LTRC lab can actually decipher the nuances between the same word used perhaps by different newspapers or political parties. While an initial frequency analysis will narrow down on the major issues that are on the radar, a more sophisticated analysis will be done to understand what people are saying about those issues. “For example, if the topic is GST, do people think it’s a necessary evil or a political stunt. I would be interested in tweets on GST before the recent amendment and after the recent amendment. I want to see if there is a change in people’s opinions on GST after this policy change. Theoretically we should be able to tell if there is a difference,” says Prof. Radhika.
As a keen political analyst, Prof. Krishnan has a hawk’s eye trained on a couple of issues that she says could assume significance in the upcoming electoral battle: Loan waivers, corruption, Ram Mandir, agricultural prices, among others. “Even if they do not appear on Twitter or appear peripherally, I’m going to see if there’s a change.” Explaining why she’s keen on bringing tweeting area and region into their analysis, Prof. Krishnan says, “GST is a bigger issue in trading centres, like Surat in Gujarat, while it might not be so crucial an issue in areas where agriculture is the mainstay. I would like to know if most of the tweets on a subject are coming from a particular city or area.”
Computational Analysis of Electoral Tweets
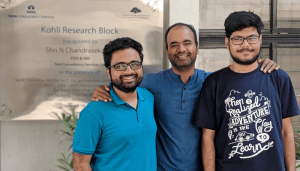
Mood of the Nation surveys can prove to be an important instrument to understand public opinion in between the 2014 and 2019 Lok Sabha Elections. While these surveys are conducted in the old-world style, Prof. Krishnan wants to find out if a digital analysis of public political sentiment throws up different findings and if so, why. She sees work here at IIIT-H as a complement to the existing political predictions and analysis. While Prof. Krishnan’s area of interest lies in the social science analysis of what users share or search for on social media, Visiting Prof. Ponnurangam Kumaraguru’s (PK) efforts revolve around computational modelling of electoral propaganda efforts and unravelling the extent to which social media can be manipulated. An expert in security and privacy in online social media, Prof. PK’s previous work in 2014 involved heavy analysis of poll-related Twitter data. Prof. PK and his student’s analysis revealed that activity on Twitter peaked during important events related to elections.They found a correlation between political behavior of the politicians and their followers count and thus popularity on Twitter. Another aim of their work was to find an efficient way to classify the political orientation of the users on Twitter. This time around too, Prof. PK is involved in maintaining a blog and a portal to capture the intricacies of political campaigns leading up to the elections as a mirror of social media.
Sifting The Real From The Fake
A popular method of creating an impression on a viewer about a political candidate is by altering the candidate’s followers online. When the number of followers surges overnight for a particular candidate, most of these followers are unlikely to be real people. It is situations such as these that particularly pique Prof. PK’s interest. Currently on the portal, there’s an analysis of when the Twitter accounts were created. “In 2014 post-elections, we looked at when all the accounts talking about elections were created, we discovered that across political parties, majority of them were created just before elections. Such an analysis can be done by someone with computer science expertise (temporal and time-series analysis). Students here at IIIT-H are doing this analysis.” Talking about the surge in the number of Rahul Gandhi’s followers in the recent past, Prof. PK says, “It’s interesting to analyse and see if the followers that a particular politician has, belong to real vs. manipulated accounts”. Explaining this as a business, Prof. PK says, “These manipulated accounts are what is known as BOT accounts. There are companies through which you can buy accounts for ‘x’ amount of dollars, giving you 1000-odd followers who will stay with you for a period of 3 years. It is a crowd-sourced model of buying likes, shares, and followers. There’s a service called Like4Like.com, You ‘like’ a particular post of users and they will start ‘liking” all your posts,There are many others like this, for example, FreeFollowers.io which enables you to buy Instagram followers and Likes too”. At IIIT-Delhi, Prof. PK was involved in building an automated mechanism to detect fake likes on Instagram with a high precision level of 83.5% and co-authored a paper Worth its Weight in Likes: Towards Detecting Fake Likes on Instagram.
Data Collection
The starting point for the team in data collection is narrowing down on all hashtags related to the elections, #generalelections2019. They will be using a standard technique used in information retrieval known as query expansion where tweets related to the official election handle are collected. Simultaneously, a closer look is taken at other hashtags too that are relevant to these elections. They have also curated data of around 300-odd politicians across parties, and territories that they’re looking at. Talking about the challenges in doing this, Prof. PK says, “This has been a fairly difficult task because while political party handles are verified, it is not the case with individual politician’s accounts. We’ve been using our own intelligence to look at the profile, the post they’re putting, how relevant it is and so on and then curating our list.”
Data Science To Meet Social Science
Referring to the misinformation spread via social media (especially WhatsApp) that played a role in catapulting Jair Bolsonaro into Brazilian presidency, Prof. PK says that it’s worth the while analyzing such content which even when proven to be doctored, plays a huge role in influencing the voters. “We are using data to run algorithms and machine learning tools on, but I don’t know the impact of such data on the man on the ground,” he admits. This is where the collaboration between the Centre for Exact Humanities is expected to play a role and provide greater insights.
For now, Prof. PK’s interest lies in building a tool for Twitter similar to the one that exists for Amazon. Amazon’s ReviewMeta site helps one make an informed choice on the product under consideration by categorizing the reviews as an original rating vs. adjusted rating. It even has the ability to flag those review comments which it thinks may be manipulated. “By the end of this semester, I would like to build a similar tool for Twitter which will basically show the number of followers vs. adjusted number of followers implying that the adjusted number are BOT followers,” As for 2019 electoral data, the stage has been set. “We’ve set up the pipeline and done all the programming. As data comes in, we should be able to get all the numbers and see visible trends,” says Prof. PK.
Sarita Chebbi is a compulsive early riser. Devourer of all news. Kettlebell enthusiast. Nit-picker of the written word especially when it’s not her own.
Next post