
In a move that is significantly useful to engineers, town planners, city and government officials as well as academia, International Institute of Information Technology, Hyderabad in association with National Disaster Management Authority (NDMA) of India recently unveiled a primer on Rapid Visual Screening (RVS) of housing structures. It is an attempt to provide a standardised checklist for data collection which will give better insight into structural safety in the wake of increasing earthquake risks.
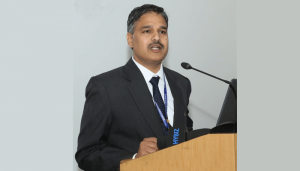
The move behind having a standardised RVS template can be traced back to 2005 when the Disaster Management Act pivoted its approach from a relief-centered one to a preventive or a mitigative one. Prof. Pradeep Kumar Ramancharla, Head of the Earthquake Engineering Research Centre, IIITH says,”56% of Indian land area is prone to moderate to severe earthquakes and 80% of population resides in these areas. Also, if you look at the buildings, most of the construction is unregulated. This is because of hitherto lack of awareness, standards, and absence of quality construction.” While newer construction is coming up under the ambit of building regulations, what then of the existing buildings? The RVS document is a step in the direction of mitigation of risk to such buildings in the event of an earthquake, where there is likely to be huge loss of life and property. An important way to reduce risk is through improving structural capacity of the buildings. And in order to do that, assessing the buildings is a prerequisite. With over 30.5 crores of buildings in India needing to be assessed, a preliminary screening through the RVS method was mooted rather than a detailed one. The intent being to minimize time, money and technical human resources required for assessing a large number of existing buildings.
Pre and Post-Earthquake Assessment
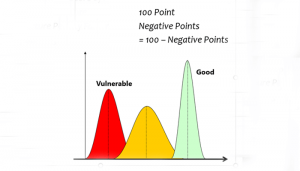
As part of the pilot study (which resulted in the publication of the primer), 7 building typologies were shortlisted out of a total of 30 typologies. And with the help of the RVS method, forms were created for pre and post-earthquake safety assessment. When these forms are used, it results in a final colour-coded score for each building based on weights given to parameters such as site and soil features, architectural form, material choices and others. A Red score stands for ‘Unusable’, Green for ‘Usable’ and Yellow for ’Usable with temporary interventions’. Likening the score to the results obtained on a health diagnostic test, Prof. Ramancharla says, “In the case of pre-earthquake safety assessment, we make recommendations on whether the building is safe or not, whether it can be made safe with the addition of certain repairs, the exact kind of repairs and so on”.
Similarly, after an earthquake has occurred, the score obtained upon completion of RVS gives an overview on the extent of damage to the buildings. More importantly, it will determine immediate occupancy of the damaged structures by the dwellers. Based on this assessment, insurance companies can disburse appropriate compensation too. “Currently, in the aftermath of an earthquake, it takes a couple of months to gauge extent of damage. For instance In the 2015 Nepal earthquake, it took 3 months to tell people whether it was safe to inhabit their homes. With the help of these forms, we can now get that information within a few days,” says Prof. Ramancharla.
Subsequent Steps
The information obtained through the forms can also help in prioritizing buildings for retrofitting needs to help improve the performance of the building in terms of life safety and economic loss.
“Right now our focus is on life safety. Once that is done, we will work on estimating loss in economic terms. If we can use drones in conjunction with the available forms, a complete picture will be available to us instantaneously,” says Prof. Ramancharla. Since it is difficult to collect detailed information of all buildings of a certain typology across India, the team has proposed that at least 1% of the total number of buildings will be surveyed in major cities (with population of over 3,00,000) located in Seismic Zones III, IV & V. And, after estimating Earthquake Risk Index of each typology from the 1% surveyed buildings, the goal is to extrapolate the Earthquake Risk Index of each city using the total number of houses of each typology in that city.

Sarita Chebbi is a compulsive early riser. Devourer of all news. Kettlebell enthusiast. Nit-picker of the written word especially when it’s not her own.
Next post