
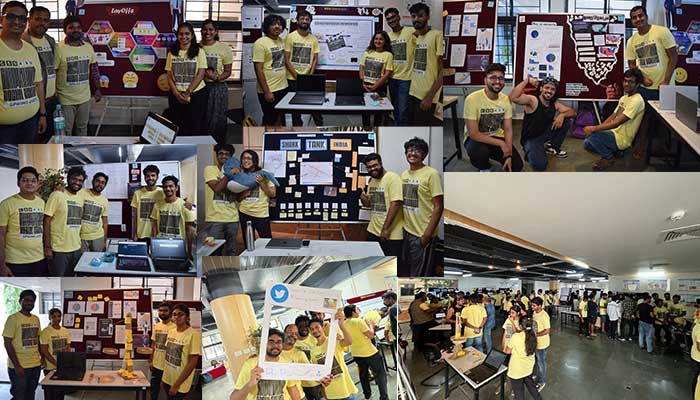
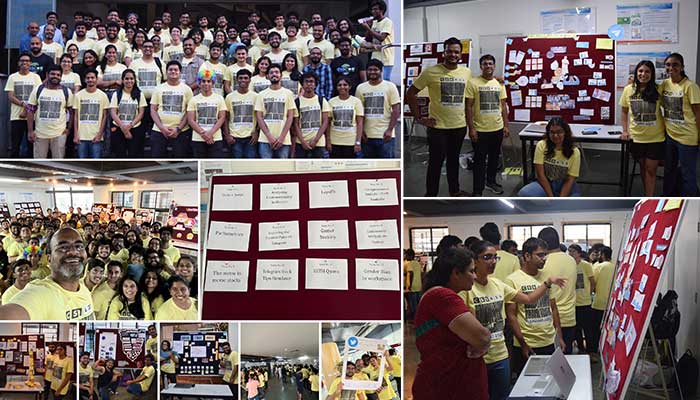
What do the prices of marijuana have to do with instances of gun violence in America? Is there a distinct pattern of investment by sharks and by industry type in the Indian reality show? Do controversies benefit box office collections of movies? Insights into these and many more were revealed via a poster presentation culminating the Spring edition of the hugely popular Computational Social Science course.
“A computer scientist typically starts by saying, let’s go get data and then you can ask whatever question you want, whereas a social scientist will ask the question first and then probably think of data later,” states Prof. Ponnurangam Kumaraguru, aka PK, going on to add,” The tendency of CS students is that data hai, sab kuch kar lenge ..so that’s the myth I want to bust with this class and in the process educate them with a poster making session thrown to public.” Prof. PK is referring to the elective course ‘Computational Social Science’ that comes with no prerequisites on the sidelines of the event. By virtue of the course being open to any interested UG3, UG4, MTech, MS and PhD student, an array of posters on a host of social themes were presented by a mix of students.
Indian Shark, Doo Doo Doo Doo
The underlying thread unifying all the projects was big data, evaluated however from the perspective of social science. “For our project, we wanted to do something to help entrepreneurs,” begins Nukit Tailor. And what better place to begin with than the business reality television series, Shark Tank. “We wanted to give it an Indian flavour though and hence tried to analyse data from the Shark Tank India,” he continues. In order to help investors better their pitch or pitch to the right investor, the team that included Eshika Khandelwal, Adith John Rajeev, Sankalp Bhat and Nukit conducted a statistical and linguistic analysis on data obtained through (subtitles of) YouTube videos of each episode uploaded by Sony LIV. By manually annotating every available word spoken by both contestants as well as the judges in the entire first season of the show, the group created a large dataset of transcripts. Expecting to find known gender biases that existed on the show such as the type of firms women sharks typically invest in, their analysis revealed other interesting insights too. “We made a correlation matrix and displayed correlations with P values less than 0.06. It is noteworthy to find that Piyush had a positive correlation for male contestants and a negative correlation with very low P values for females and couples with business ideas,” says Eshika. Other statistics that stood out were that middle-aged participants tend to quote higher initial ask amounts compared to those younger, transgender pitchers were more prevalent in the service industry and so on. Meanwhile, the team’s linguistic analysis looked at noun by verb ratio. “If it is high, the nouns are more and it means that the person is using more tech terms,” explains Eshika. They trained their lens on sentence variance lengths which revealed that if you use shorter sentences, the success of the pitch was higher. “The analysis can serve as a guide to young and upcoming investors on what to avoid or what to focus on while pitching. Plus, this first-of-its-kind dataset can help the community; one can build a machine learning model to judge the success of a pitch,” says Sankalp.
Ask Qs; Get Quality Answers
If you are looking for first-hand experiences and stories online, the platform Quora trumps over a regular search engine search. Plus, the fact that the questions are answered by interested folks makes it slightly more credible. “A lot of decisions by parents and students related to college admissions are made by studying and analysing the responses on the Quora platform,” remarks Prof. PK. A team of his students that included Yash Mehan, Pratyaksh Gautam, Bhaskara Hanuma, Harshit Gupt and Jatin Agarwala decided to focus on questions about IIITH on Quora. “Quora does not provide any APIs; we had to scrape the data manually using Selenium with keywords like UGEE, IIITH, and IIIT- Hyderabad and thus came up with 1800 records,” says Jatin. There are answered questions and many unanswered ones which the team then proceeded to analyse via topic clustering. “We found that questions about the sports scene on campus, DASA score cut off, which sections of books should be studied to get into IIITH and so on were answered more by non-IIIT-ians than the IIIT-ians,” says Yash. “It was definitely interesting to note that more number of answers related to questions about IIITH were given by the non-IIITH-ians,” says Prof. PK, adding that some of the responses were inaccurate. One of the things unique to IIITH is the opportunity given to undergraduate students to double up as TAs. “Questions related to Teaching Assistantship therefore were more likely to be discussed by IIITH-ians,” reveals Yash. They also found that very few professors responded to questions posed about the institute. “We should probably encourage them to respond more since they tend to have more precise knowledge about the curriculum and so on,” says Yash. Given the administrative role of PG Chair that is currently helmed by Prof. PK, he says, “I’m really looking forward to setting up a small team of students that can actually look at these questions and respond.”
Guns vs. Ganja
With a provocative title like that, it was little wonder that this presentation had quite a few curious onlookers. The student team of Manav Chaudhary, Harshavardhan Nemani, Mugundan Kottur Suresh, Aaryan Sharma, and Bhaskar Joshi set out to investigate if there’s a correlation between fluctuating weed prices and instances of gun violence in American states. They discovered a positive correlation between the two variables. “It means that when the price of weed per gram changes, it can explain about 2.4% of the variation in the number of injuries due to gun violence,” says Bhaskar. When other factors were considered such as the price per gram, education levels and the percentage of blacks in the state, 18.6% of injuries and 8.2% of deaths could be attributed to them alone. “An interesting fact was that if you have more whites in your community, there’s a decreased chance of getting injured but an increased chance of actually dying,” exclaims Manav. The team also argued that based on the statistical values in Republican states, if one is buying weed today, the chances of that person committing a crime shortly thereafter is high. “We could explain all this to a better extent if we had data on more variables such as income of communities, and the political split in the states and so on, but unfortunately that data was not publicly available,” states Harshavardhan.
Legislative Research
We know that little business, if any, gets transacted in the houses of Parliament what with frequent disruptions, walkouts, and eventual adjournments. Aptly titled, ‘Parliametrics’, students Hardik Gupta, Rahul Garg, Srijan Chakraborty, Vanshpreet Singh and Vidhi Pareek wanted to come up with a metric to see how the Parliament functions. “We took parliamentary debates and analysed to see if some interesting insights came up,” explains Srijan. Three different kinds of analysis were undertaken – party-wise, temporal and speaker-wise analysis. For party-wise analysis, the team correlated speeches with actual party manifestos given in 2019. “We found that the Congress talks about promises, education, women, rights, what they’re going to do rather than what they’ve already done in the years that they were in power,” says Srijan, continuing that the BJP on the other hand, talked more about nationalism and the country as a whole. “It shows that the Congress is promising things while the BJP wants to maintain status quo,” he says. A temporal analysis revealed topics discussed in the Parliament month-wise, and showed that debates reflected the current affairs happening both in India as well as internationally. For instance, February and March coincided with debates on farmers’ protests, as well as those around the Rafale defence deal. While analysing debates per Speaker, the team found that while national party stalwarts like Rahul Gandhi and Narendra Modi were conspicuously missing in parliamentary debates, unsurprisingly BJP’s most prolific speaker was Nirmala Seetharaman who spoke on a variety of topics, Nitin Gadkari stuck to speeches concerning his portfolio as opposed to national politics and so on.
Understanding Political Popularity
Given the high popularity of a democratically elected leader like Narendra Modi, the team sought to understand and analyse public perceptions on how the government handled issues via an online medium like Telegram and an offline one such a survey. “We chose Telegram as our data source since it wasn’t studied as much as Twitter and Whatsapp,” says one of the students. When anonymity was present through politically-affiliated groups on Telegram, they found that public sentiment was more negative than when opinions were sought through the survey. Additionally, biases were found on these groups who were pushing through political agendas.
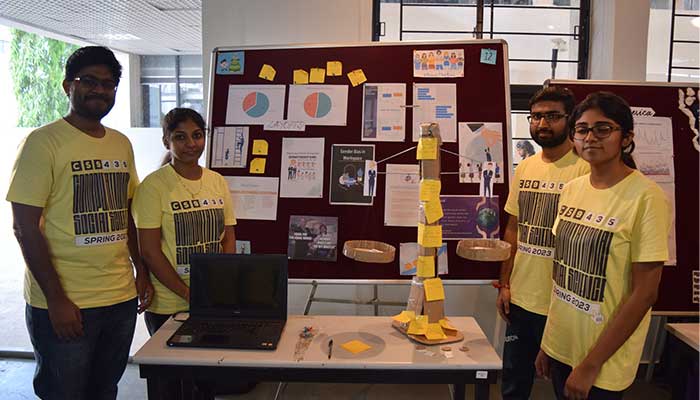
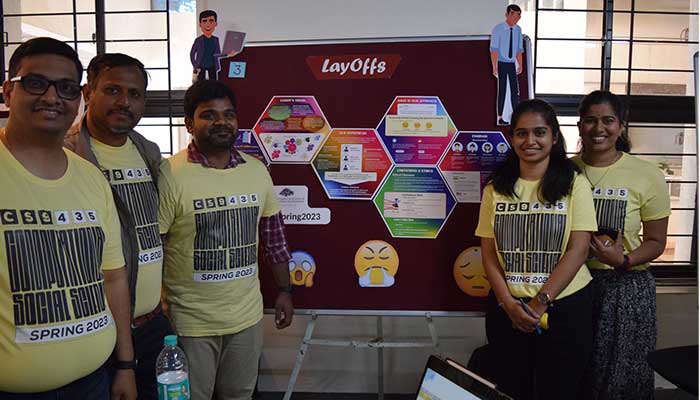
Toxic Gamers and Stock Market Tips
From analysing gender biases at the workplace or seeing if there’s a pattern to the recent layoffs, to studying if controversiality in movies has anything to do with its box office collections (think Pathaan and Padmavat), to exploring interactions of gamers vs. non-gamers on Reddit and determining if toxicity emerges by mere virtue of donning a gaming avatar, to a stock market project revealing insights enough to rattle experts, the Spring edition of the 2023 class of Computational Social Science was engaging, insightful and much more.
March 2023