
It’s a theme that has been rehashed to death by Bollywood: siblings separated at melas. While a happily-ever-after reunion happens in reel, massive, unorganized crowds, pandemonium and panic often leading to stampedes are real. Let’s look at how technology from the Lab for Spatial Informatics at IIIT-H can play a role in providing a solution for effective crowd management.
Rivers occupy a sacred place in Hindu tradition. Bathing in them is said to cleanse one of all sins. Much like the Kumbh Mela that occurs once in 12 years in North India at any of the four given locations alongside a river, closer down South are the ‘Pushkaralu’. Not to be mistaken for the Pushkar (or camel) fair that occurs in Rajasthan, the Pushkaralu are festivals where the rivers Godavari, Krishna, Tungabhadra, Pranahita and Bhima (near Bhima-Krishna Sangam) are celebrated in Telangana and Andhra Pradesh.
Dip, Dip, Dip
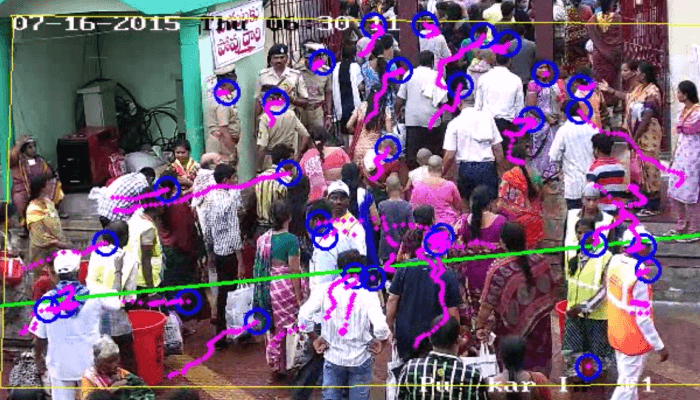
In July 2015, the Godavari Pushkaralu took place at Rajahmundry in Andhra Pradesh and it was believed to be a Maha Pushkaralu, one that takes place once in 144 years. Handling the rush of pilgrims to the ghats along the Godavari during the 15 auspicious days was expected to be a gargantuan task. From merely deploying and scrutinizing CCTV camera footage along the areas of the ghats to maintain law and order, the Government of Andhra Pradesh sought a solution that would also assist in estimating footfall and getting insights on crowd density in real time. Most solutions that exist in the market apply to situations when people are walking in an orderly fashion or standing in a queue in the retail context. They typically don’t work in the context of massive crowds that one witnesses at religious or social gatherings/events. When the AP Government approached the Lab for Spatial Informatics (LSI) at IIIT-H, the lab was working on a similar video analysis albeit in the area of vehicle counting. Prof. K.S. Rajan who heads the lab says, “At the time, we had a graduate student who was working on UAV (Unmanned Aerial Vehicle, like a drone) imagery and video surveillance cameras to identify and track vehicles, and to understand traffic patterns. We decided to tweak this model and see if it works for head counting.”
Detect, Track and Count
The goal of the project was to arrive at head-counts. While there are traditional approaches to this such as volunteers using a counting system, they come with their own limitations. Even more sophisticated approaches such as the usage of drones is fraught with shortcomings: chances of re-counting the same people are high. “We decided to ignore UAVs and focussed only on the cameras set up at entrances to the 13 ghats, each with different capacities, because that was where crowds were expected to be at the maximum. The idea was to identify the flow of people entering the ghats and use that flow to calculate the number of people, “ explains Prof. Rajan. The team combined three different things: Detecting people, tracking them, i.e, seeing if they actually move and cross an imaginary line, and then counting them. Such a process not only defined the physical boundaries of the area to be analyzed, but also ensured that volunteers and other support staff such as the police force manning the entrances of the ghats would not be repeatedly counted.
Deriving knowledge From Data
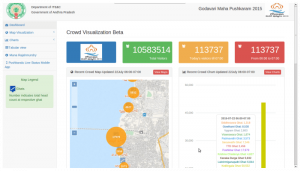
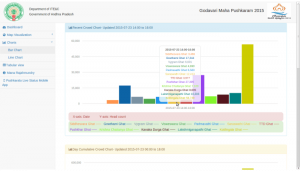
“Though the Government’s requirement for the Pushkaralu was only the number, since previous data was available, we generated a Web-GIS dashboard to assist the visiting travellers. Basically, it means that on the web, you are getting geo-spatial information. One can zoom in and out and see numbers of people present at each ghat, for the past hour,” says Prof. Rajan. LSI had previously worked with a local university, Adikavi Nannaya University in Rajahmundry on a Municipal-GIS project under a GoI Department of Science and Technology-funded project. As part of this earlier initiative, the entire city of Rajahmundry, its road network, the ghats, along with locations of ATMs, government and private hospitals, hotels and medical shops, had been mapped. Besides pilgrims using the information to plan their visit, the Police began using the data effectively to make announcements about density of the crowds at the ghats, and divert the pilgrims to lesser-crowded ghats. With crowd trends represented through maps and graphs, such as which ghat was likely to be crowded at what time, it helped the Governmental agencies to mobilize their resources effectively, reallocate volunteers, and streamline essential supplies to the pilgrims.
From Web to the App
An open source Geo-spatial solution provider named Kaiinos, a IIITH-CIE startup, was roped in to help out with the operational part of the project. It deployed and operated the website and maintained the dashboard-based user interface. Seeing the huge response to the website from the citizen community, in addition to the primary Government users, the team decided to build a mobile application as well to increase the reach. An Andhra Pradesh-Telangana based open-source community called Swecha, came forward to build the front-end of the web-based dashboard in the form of a downloadable app. “Google Analytics was connected to the website and when we did our analysis, we found that 55% were mobile users. This implied that most users of the website were hitting the website through their mobiles rather than directly. Most pilgrims before even embarking on their journey were found to be using the data to plan and decide whether they should venture out in the first place, and if yes, which ghat to visit,” remarks Prof. Rajan. We were also supported for IT infrastructure including high-end computing systems by a third party company called Mobile Digiconverse with expertise in system development, which helped us to run the operations smoothly over the course of the project. Many local volunteers from the Adikavi Nannaya University as well as an engineering college joined hands too.
Successful Solution
An unfortunate stampede that occurred on the first day in the first hour of the opening up of the ghats, corroborated the importance of having crowd analytic information to predict where overcrowding is likely to occur. While the team estimated a 70-75% accuracy, the numbers were better than the manual count undertaken by some volunteers and the Police force. “We ourselves were surprised that our numbers had lesser error than what we had anticipated,” remarks Prof. Rajan. Though the Govt. wanted an entire day’s head count to be made available the next morning, the team committed to making this information available every 3-6 hours. “Interestingly, we started providing this information every hour!”, says Prof. Rajan. Speaking about such projects, Prof. Rajan very candidly says that only 30-40% is technology and the rest is dealing with the operational challenges.
Industry Partnerships
The same team managed live data feeds of crowds at another event in 2016, the Krishna Pushkaralu along the banks of the river Krishna in Vijayawada. Currently, the Technology Transfer Office at IIIT-H is trying to build a marketing model around this visual analytics solution and trying to find clientele to whom this can be transferred. “The solution can be used anywhere where the flow of people is not well organized. The current available commercial methods are all meant for a queue kind of a model where there is sufficient spacing between each person. We wanted our data to be available in near real time and were erroneous by only less than 5%. In models like this, there is always a trade off between accuracy and speed of computation,” remarks Prof. Rajan.

Next post